
Why creative production KPIs need an upgrade
Most ad studios still measure success with a blunt metric: “How many assets did we ship this month?”
For high-volume display and HTML5 campaigns, that’s not enough.
Modern creative operations need a KPI model that connects:
Flow – how work moves from brief to launch
Quality – how well assets adhere to brand and best practices
Activation & reuse – how much of what you make actually runs and gets repurposed
Impact – how creative performance shows up in media KPIs
Platforms like Adobe GenStudio, Bynder, Smartly, Bannerflow, Celtra, and CreativeX are already exposing dashboards across these dimensions. If your team is still tracking only “ad counts,” you’re flying blind.
This article breaks down five practical KPI categories for creative production leaders and shows how to turn them into a dashboard your CMO, head of creative, and media team can all use.
The 5 KPI pillars for creative production
The most useful creative production KPIs fall into five buckets:
Throughput & capacity – how much you can reliably ship
Error rates & rework – how often work comes back or breaks
Turnaround times & SLAs – how fast you can respond
Reuse & activation – how well you leverage assets at scale
Impact on media performance – whether better production actually pays off
Each pillar should be traceable to specific, operational definitions you can automate.
Below, we’ll define each metric, give benchmark guidance, and show where a specialized HTML5 production platform like Viewst can help.
1. Throughput: how much work can your ad studio actually handle?
Throughput KPIs give you a realistic view of capacity so you can plan campaigns and headcount.
Core throughput metrics
For banner and HTML5 ad production, define:
Campaigns produced per month
Number of distinct campaigns where at least one full banner set (all required sizes) is shipped.Ad units produced per month
Count of individual ad files produced (e.g., 20 sizes × 10 variants = 200 ad units).Ad units per FTE per month
Ad units produced ÷ number of full-time production/design staff.Automation coverage rate
Percentage of ad units generated via automation (e.g., smart resize, templates) rather than manual builds.
Why it matters
Real‑world case studies show what’s possible with a proper system:
Gannett’s marketing ops team handled 50–70 campaigns per month across 200 markets using structured processes.
Bannerflow reports 10x faster ad production, with campaign updates and exports dropping from 80 hours to 8 hours or less.
Celtra cites 19.5x higher production efficiency for Nike and cycle times reduced from 2 weeks to 3–5 days.
These aren’t “work harder” stories. They’re system stories — the result of treating banner production as infrastructure, not a series of one-off design requests.
How Viewst helps throughput KPIs
Because Viewst is HTML5-native and master‑creative driven, throughput gains typically come from:
AI Smart Resize – one master turned into all required sizes
AI Instant Animator – motion applied once, propagated everywhere
Production-ready export – HTML5, GIF, MP4 from a single environment
That means your throughput metric becomes “master creatives per month” more than “raw ad counts,” which is a more honest representation of design effort.
2. Error rates & rework: how often does work bounce back?
Non-templated creative work is error-prone. Adobe’s planning guide notes that teams without templates see 10–30 errors per 100 opportunities.
For enterprise display production, each error creates:
Extra QA loops
Risk of off-brand or non-compliant ads going live
Burnout from last-minute fixes
Core error & rework metrics
Ad production error rate
(Number of defects found in QA ÷ total ads produced) × 100.
Defects include wrong logo, fonts, colors, copy, tracking tags, click URL, or animation behavior.Rework rate
(Number of assets sent back for changes after “final” approval ÷ total assets) × 100.Root cause distribution
Share of errors by category: brief issues, brandbook non-compliance, manual resizing mistakes, wrong export settings, etc.Template adherence rate
% of ads built from approved templates vs. custom one-offs.
Benchmarks and goals
With no templates and manual processes, a 10–30% error rate per 100 outputs is common.
Your medium-term goal should be single‑digit error rates (under 5–7%) for template-based work.
How Viewst reduces errors
Viewst’s brandbooks and governed templates act as guardrails:
Locked typography, colors, and logos across all sizes
Master creative as a single source of truth for all variations
True WYSIWYG editor, so what you see is what actually ships
Because resizing and animation are automated against the master, you remove a major source of error: manual re-layouts and exports.
3. Turnaround time & SLAs: how fast can you respond?
Speed-to-market is a competitive advantage in performance marketing.
Your media team needs answers to questions like:
“If I brief a net-new banner set, when can I go live?”
“If we get new legal copy today, how fast can we update all sizes?”
Core turnaround metrics
Track these at the campaign level:
Brief-to-first-preview time
Time from brief acceptance to first preview delivery.Brief-to-final-approval time
Time from brief acceptance to sign-off.Brief-to-go-live time
Time from brief acceptance to assets delivered to media / ad server.Average change request turnaround
Time from change request to updated assets delivered.SLA compliance rate
% of projects delivered within agreed SLAs (e.g., 3 days for updates, 7 days for net-new campaigns).
Why workflow rigor matters
Adobe’s planning guide highlights:
39% of respondents say poor planning is a major cause of project failure.
20% of overtime is attributed to insufficient staffing.
Less than half of in-house creative teams track time at all.
Without real turnaround metrics, you can’t defend your team or negotiate realistic SLAs with marketing and media.
How Viewst changes SLAs
With Viewst, teams can credibly move from “we need weeks” to “we need days” because:
Figma / Adobe imports speed up starting from brand-owned designs.
AI Smart Resize turns new copy or imagery into a refreshed banner set in minutes.
In-tool review and commenting shortens approval cycles by keeping stakeholders inside the production environment.
A practical SLA you can adopt post-automation:
Net-new campaign from existing brand system: 5 business days
Variant or localization of an existing master: 24–72 hours
4. Reuse & activation: the biggest hidden efficiency lever
CreativeX estimates that more than half of content produced is never activated, and that the average Fortune 500 company wastes at least $25 million a year on unused creative. Industry-wide, that’s about $100 billion in wasted spend.
That’s not a design problem. It’s a production and governance problem.
If you don’t measure activation and reuse, you will keep over-producing net-new assets instead of scaling what already works.
Core reuse and activation metrics
Borrow CreativeX’s lifecycle definitions:
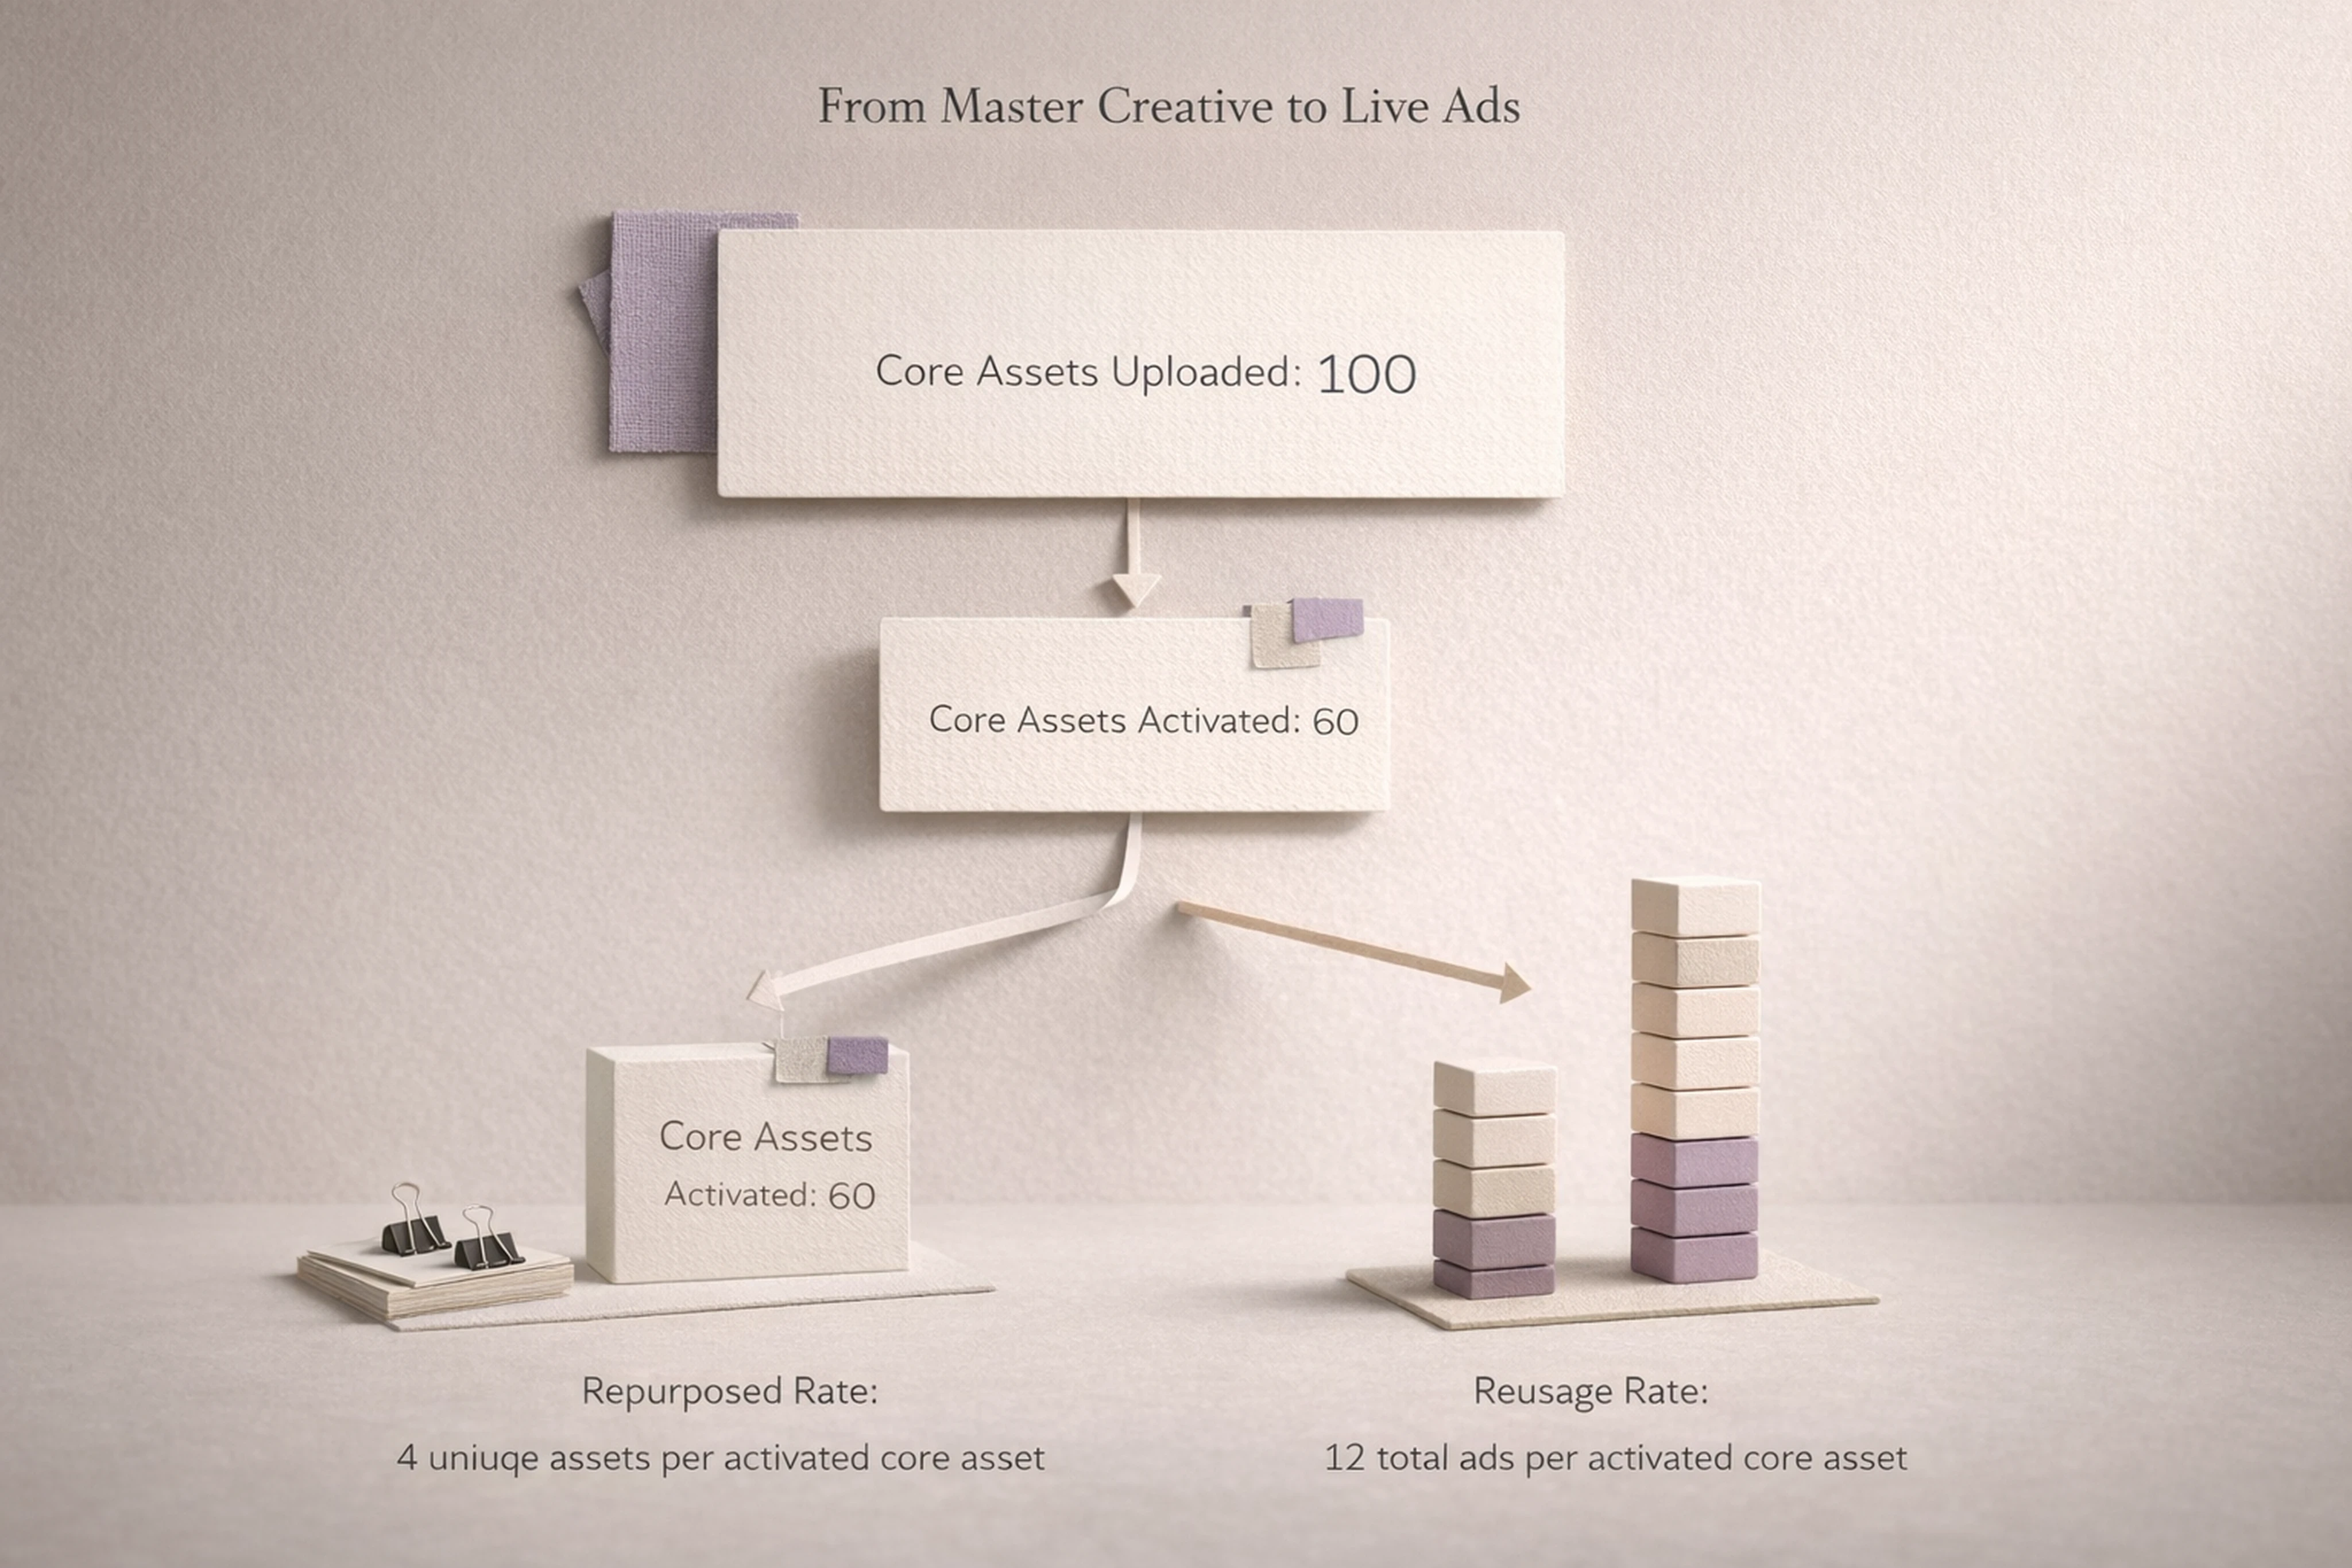
Core assets uploaded
Number of master creatives added to your system.Core assets activated
Number of master creatives that actually went live in at least one channel.Activation rate
Core assets activated ÷ total core assets.
Indicates how much of what you design makes it out of the studio.Repurposed rate
Unique assets connected to a core asset ÷ core assets activated.
Shows how many derivatives you create from each master.Reusage rate
Total ads connected to a core asset ÷ core assets activated.
Measures how deeply you exploit each master creative across markets, formats, and placements.Localization coverage
% of priority markets using localized versions of key master creatives (vs. generic global creative).
Here’s how the value stacks up visually.
What good reuse looks like
In a healthy system:
Activation rate is high – most master concepts ship.
Repurposed rate is strong – each master drives multiple variants (formats, languages, audiences).
Reusage rate is high – each master remains a living asset reused for tests, new markets, or seasonal refreshes.
Viewst is built around this model: the master creative governs all derivatives, and AI-driven resizes and animation make reuse the default, not a special project.
5. Impact on media performance: does better production actually pay off?
Creative isn’t just a cost center; it materially affects media efficiency.
CreativeX reports that a 10% increase in Creative Quality Score is associated with:
4.7% decrease in CPM
4.6% increase in ad recall
17.4% decrease in CPCV
In one example, Meta data showed ads with higher Creative Quality Score delivered 66% higher ROAS for Nestlé.
WARC’s 2026 analysis also found campaigns with high media and creative quality achieved:
5.3x stronger brand awareness lift
2.5x better ad recall than lower-scoring campaigns
Creative quality metrics for display ads
Define a practical Creative Quality Score for your banners based on binary checks:
Brand compliance – logo, colors, and fonts match your brand system
Legibility – copy size and contrast pass minimum standards
Clear CTA – visible, action-oriented call-to-action
Product visibility – product or value prop clearly present
Best-practice structure – hierarchy of brand, product, and CTA is consistent
Each ad receives a score (e.g., 0–5 or 0–100). Then track:
Average Creative Quality Score by campaign
Creative Quality Rate – % of ads that pass all checks
Correlation between quality score and media KPIs – CTR, CPM, ROAS, conversions
Motion and format quality
Google’s Performance Max playbook shows that advertisers who upload at least one video see an average 12% lift in total incremental conversions. Those who provide horizontal, vertical, and square video see 20% more conversions on YouTube than horizontal video alone.
For HTML5 display, you can mirror this philosophy by tracking:
Rich media coverage – % of campaigns using motion or interactivity
Story speed – time to main message in the animation sequence
Variant mix – balance of static vs. animated banners by campaign
Viewst’s AI Instant Animator helps you add motion at scale without shifting work to motion specialists, making it more realistic to test the impact of animation on performance.
Putting it all together: a practical creative production dashboard
A useful creative production dashboard should answer two questions:
Are we operating efficiently and predictably?
Is our output making media more effective?
Here’s a practical dashboard layout you can implement in any BI tool or directly inside a platform like Viewst.
1. Flow & capacity panel
Campaigns produced per month
Ad units per month
Ad units per FTE
Automation coverage (% built via templates / AI)
2. Quality & error panel
Ad production error rate
Rework rate
Template adherence rate
Creative Quality Score (average + distribution)
3. SLA & turnaround panel
Average brief-to-first-preview time
Average brief-to-final-approval time
Average brief-to-go-live time
Change request turnaround time
SLA compliance rate (% delivered on time)
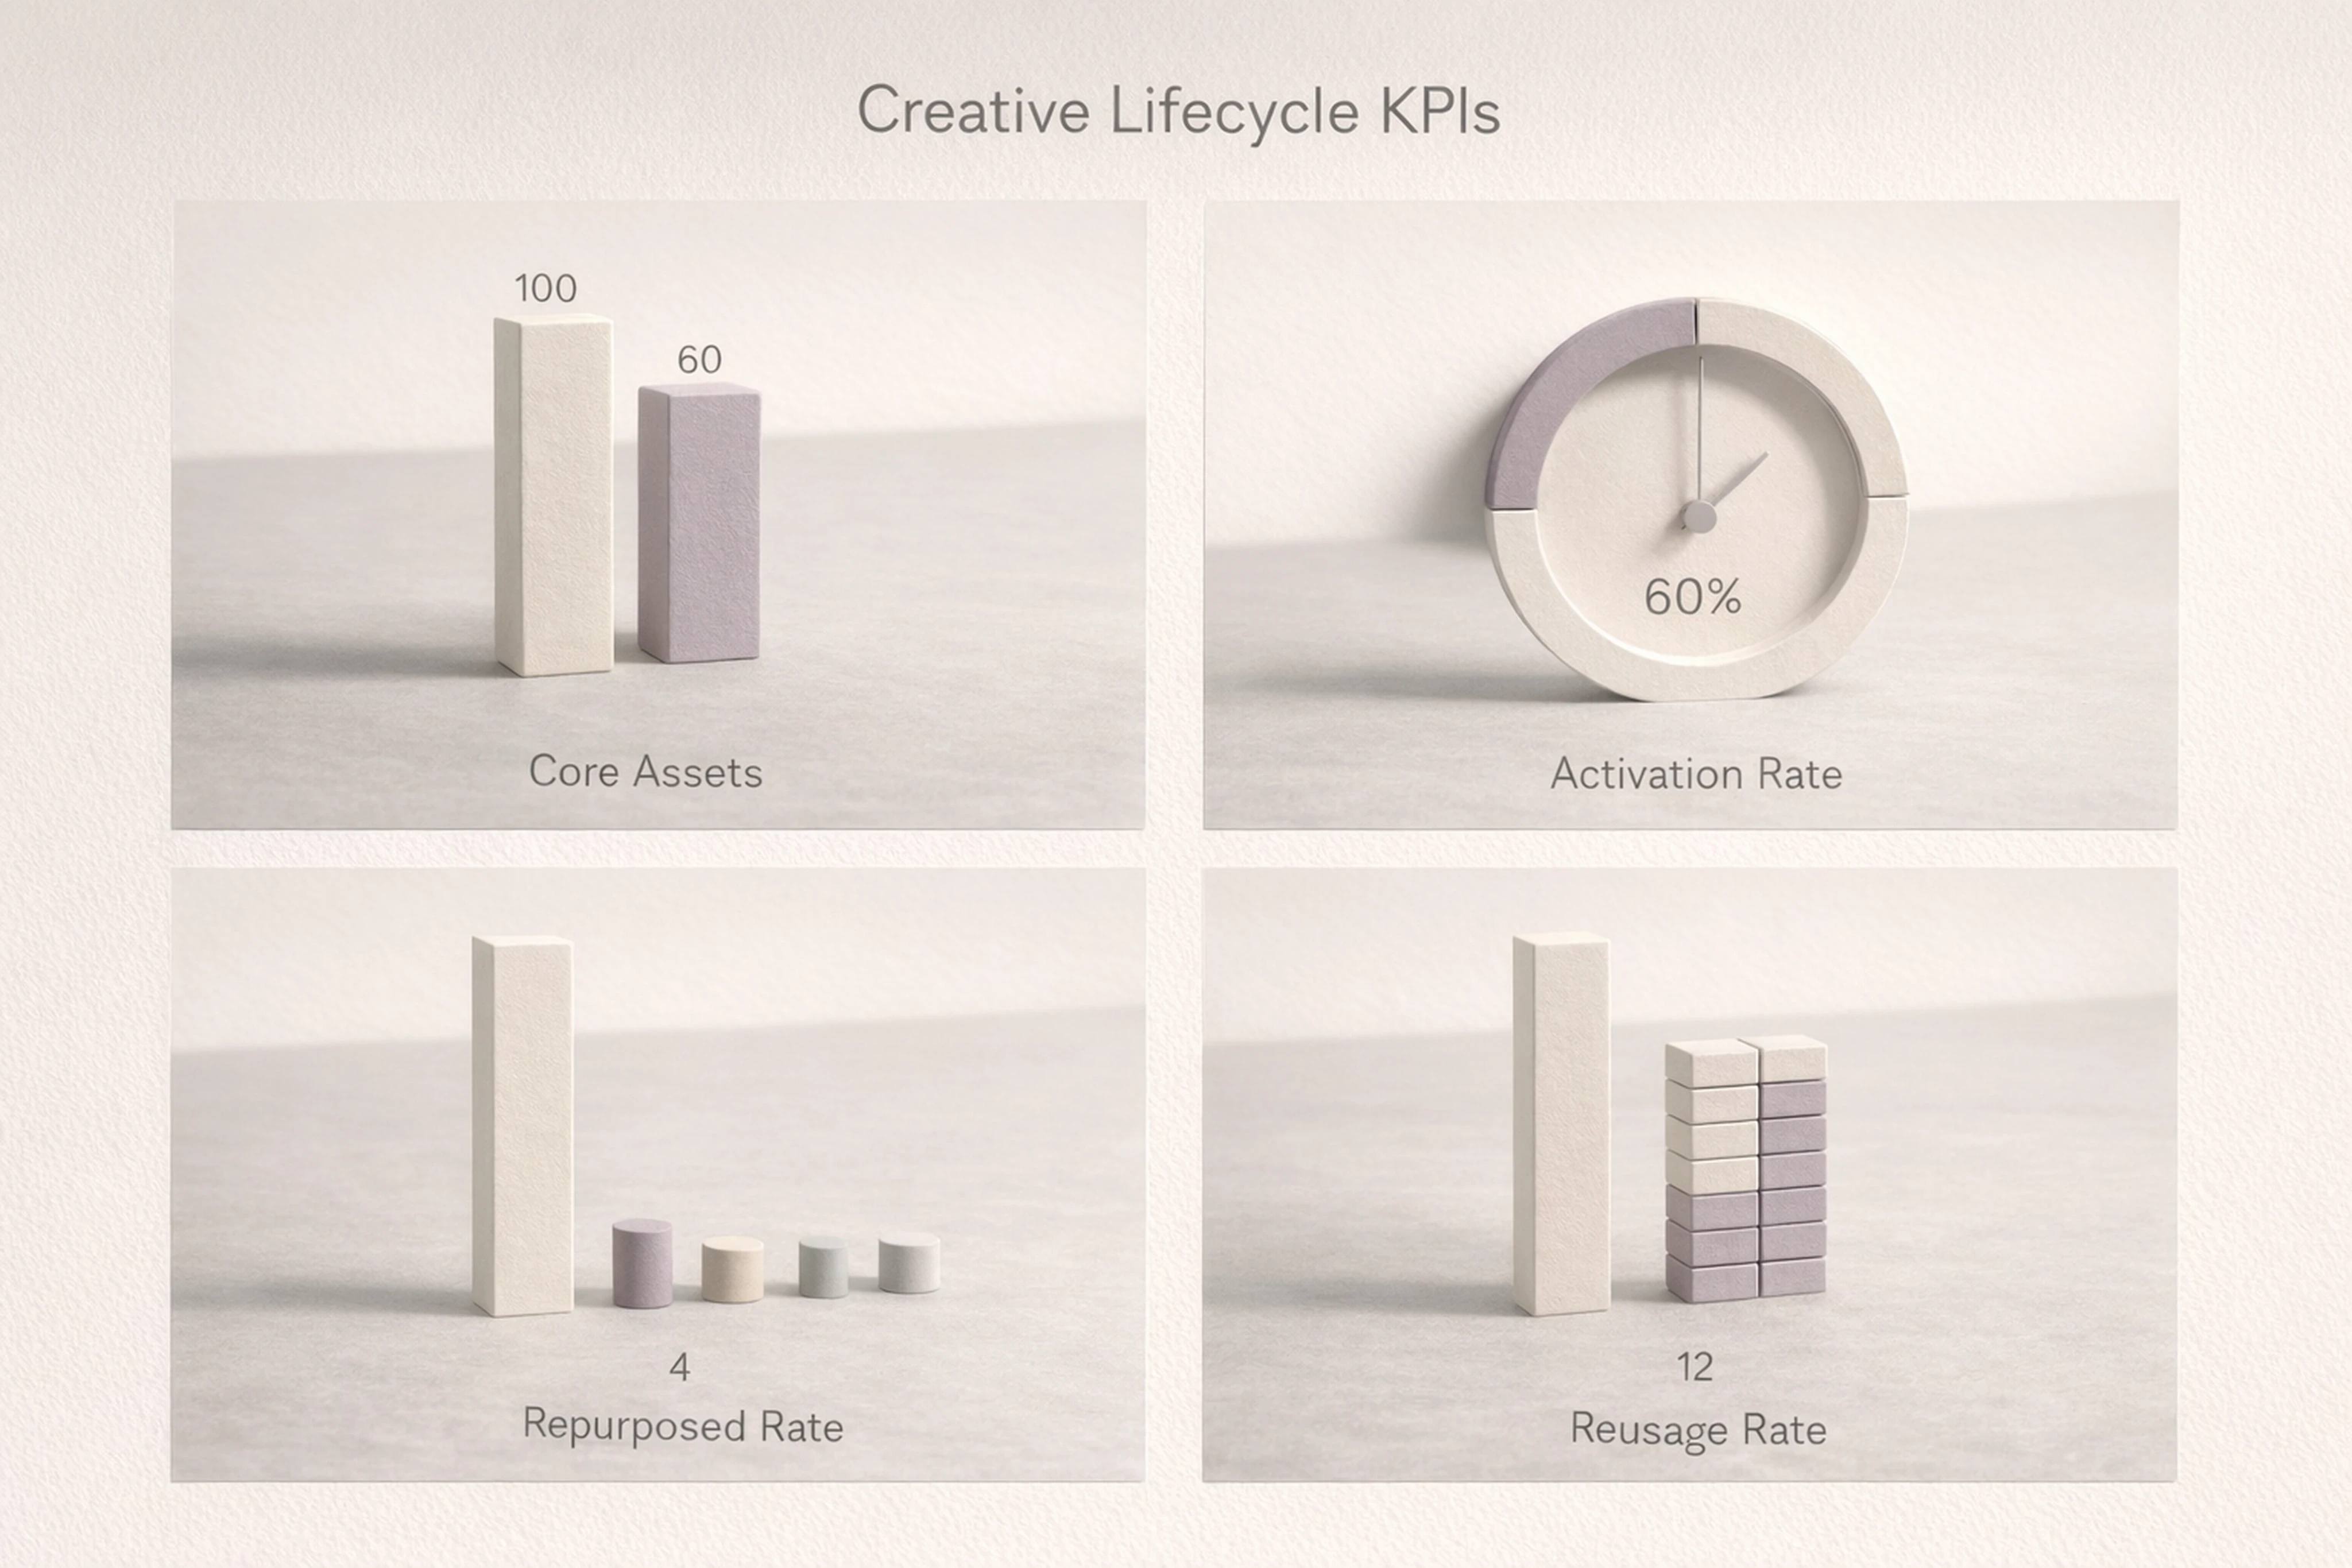
4. Reuse & activation panel
Core assets uploaded
Core assets activated
Activation rate
Repurposed rate
Reusage rate
5. Media impact panel
Integrate with your ad server, DSP, or analytics stack to show:
Average CPM, CTR, ROAS by Creative Quality Score band
Media efficiency gains for high-quality vs. low-quality creative
Impact of motion (animated vs. static banners)
This is where you close the loop and demonstrate that governed, automated production is not just about speed — it’s about reducing media waste.
How Viewst aligns with governed AI production
The market is clearly moving toward governed AI production, not open-ended image generation.
Adobe GenStudio, Celtra, Bannerflow, and Storyteq all emphasize templates, brand controls, and real-time insights. Viewst sits in that same category but is purpose-built for HTML5 and display.
Key differentiators that directly support the KPI model above:
AI for production, not just generation – Smart Resize, Image Deflatening, Instant Animator, and AI Designer all work from a master creative.
Native HTML5 – output is clean, editable code ready for ad networks, not flat images.
Brandbooks and governance – locked styles propagate across all formats and markets.
Integrated review and approval – comments and sign-offs live where the creatives are made.
The result: your KPIs don’t fight your tools. They’re baked into the way work is produced.
FAQ: creative production KPIs for ad studios
1. What are the most important KPIs for creative production?
For high-volume display and HTML5 work, the most impactful KPIs are:
Throughput (campaigns and ad units per month)
Ad production error rate and rework rate
Turnaround times and SLA compliance
Activation, repurposed, and reusage rates for master creatives
Creative Quality Score and its correlation with media metrics like CPM and ROAS
If you track only output volume, you miss the real levers: reuse, quality, and impact.
2. How do I benchmark error rates and rework in my ad studio?
Start with a 3–4 week baseline:
Track every defect found in QA or after launch.
Categorize by type (brand, copy, format, tagging, animation).
Divide total defects by total ads produced.
If you’re working without templates, Adobe’s data suggests 10–30 errors per 100 outputs is typical. Use that as a baseline and aim to cut it in half with templates and platform-level guardrails.
3. How do I measure creative asset reuse rate in practice?
Use a master‑creative model:
Treat each core concept as a “master creative.”
Link all variants (sizes, languages, formats) to the master.
Track:
Activation rate (masters that went live)
Repurposed rate (variants per activated master)
Reusage rate (total ads per activated master)
Tools like CreativeX and Viewst make this explicit by treating the master as the governing object.
4. How can I connect creative KPIs to media performance?
Align your creative and media data:
Assign a unique ID to each ad or creative variant.
Pass that ID into your ad server / DSP.
Pull media metrics (impressions, CPM, CTR, ROAS, conversions) by creative ID.
Join that data with your Creative Quality Score and reuse metrics.
You can then show, for example, that a 10% lift in Creative Quality Score is associated with lower CPMs and stronger ad recall, mirroring CreativeX’s findings.
5. Where does a platform like Viewst sit in my stack?
Viewst sits between design and media:
Upstream, it connects to Figma and Adobe, where master designs originate.
Midstream, it handles scaling, animation, governance, review, and export.
Downstream, it feeds HTML5 / GIF / MP4 into your ad servers and DSPs.
It doesn’t replace your design tools or your media platforms. It replaces the high-friction layer of production work where most errors, delays, and waste occur — and gives you the KPIs you need to manage that layer like real infrastructure.
By shifting from output-only reporting to a balanced KPI set across throughput, errors, turnaround, reuse, and media impact, you turn creative production from a “black box” into a predictable system.
That’s how creative teams protect their craft, media teams protect their budget, and businesses scale campaigns without burning out the people making the work.

Victoria is the CEO at Viewst. She is a serial entrepreneur and startup founder. She worked in Investment Banking for 9 years as international funds sales, trader, and portfolio manager. Then she decided to switch to her own startup. In 2017 Victoria founded Profit Button (a new kind of rich media banners), the project has grown to 8 countries on 3 continents in 2 years. In 2021 she founded Viewst startup. The company now has clients from 43 countries, including the USA, Canada, England, France, Brazil, Kenya, Indonesia, etc.
In this article
" height="11.060000000000002px" id="wzBCZ87AK" transform="translate(6.47 2.47)" width="6.590000000000003px"/></g></svg>)