
Why 80% Faster Banner Production Is a Realistic Target
For high‑volume display teams, an 80% reduction in banner production time is not a moonshot. It’s already happening.
Vendor case studies consistently show similar or better gains:
South China Morning Post cut production from 1 hour to 10–15 minutes per banner (a 75–83% reduction) and scaled from 1–2 to 5–6 campaigns/month.
McDonald’s Finland dropped repeat launch time from 27.5 hours to 2 hours and increased output 5x.
Betway saved 15,500 hours producing 24,000 banners—about 38.75 minutes saved per banner.
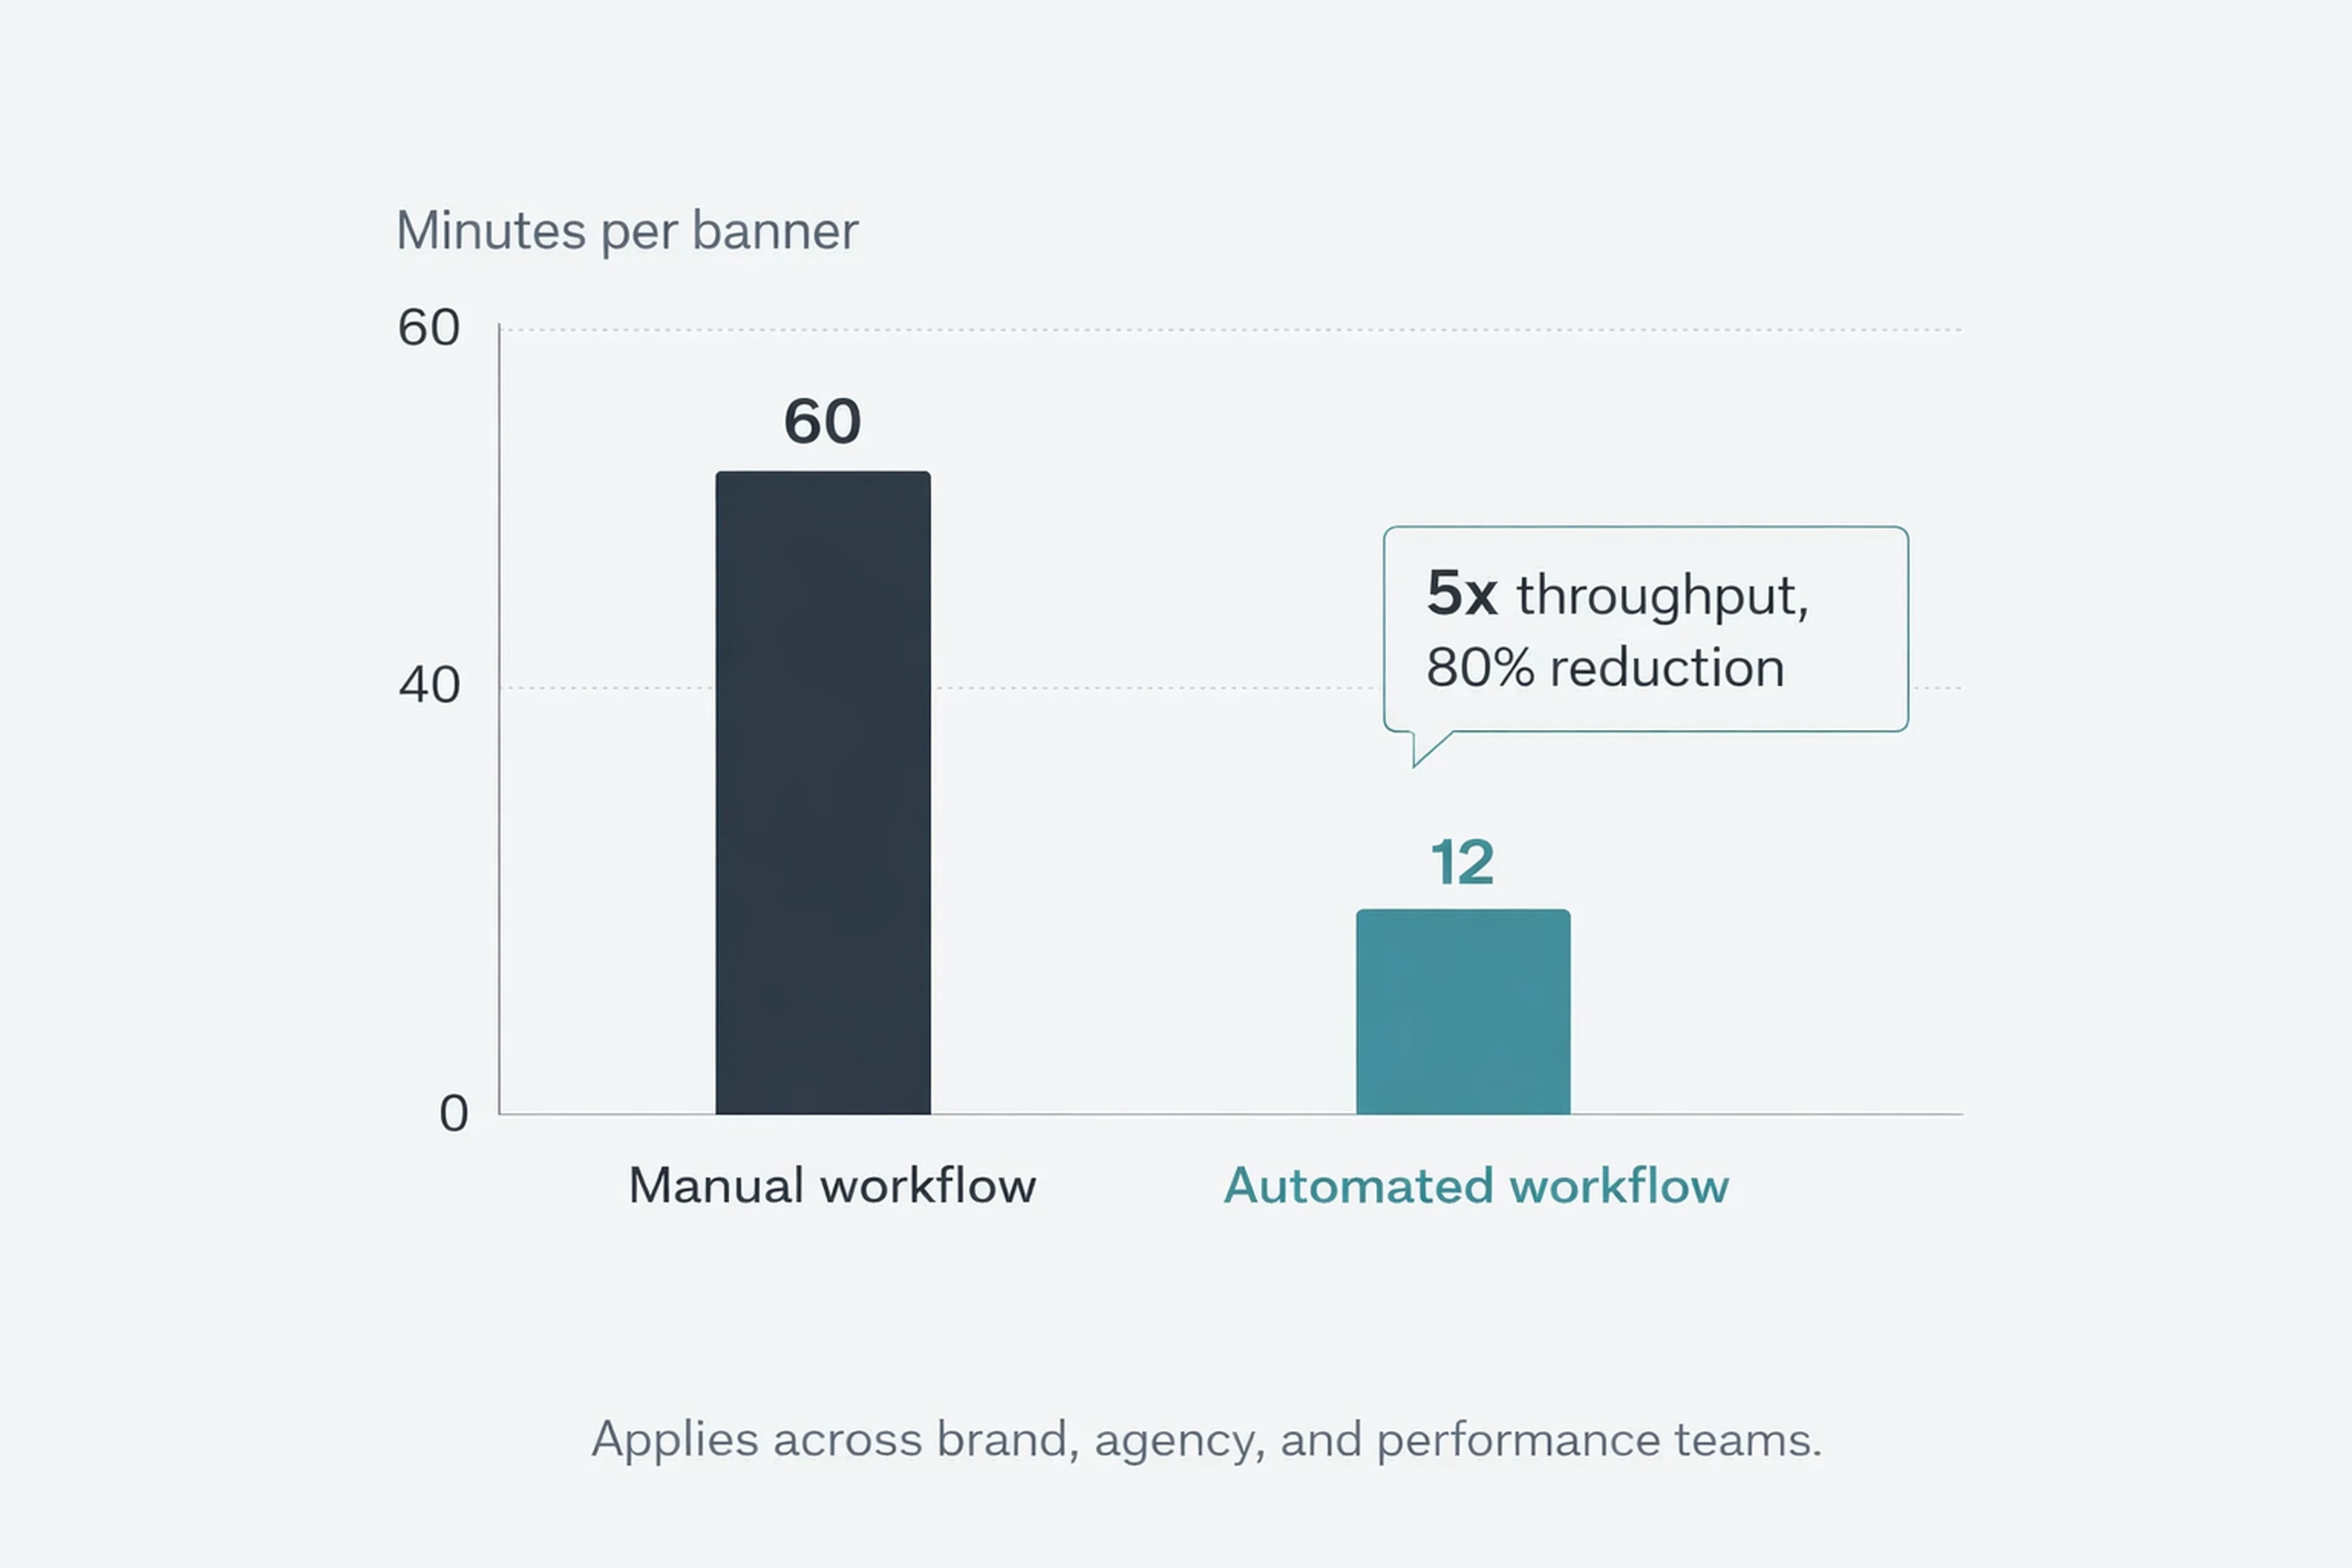
If you move from 60 minutes to 12 minutes per banner, that’s exactly an 80% time reduction and a 5x throughput increase.
This article gives you:
A quantitative ROI framework for creative automation in display advertising.
Three worked examples (brand, agency, performance team) with time, cost, and testing gains.
A lens on how an HTML5‑native production platform like Viewst fits into this model.
The Real Problem: Production Overhead, Not Design Quality
Creative leaders rarely complain about concepting or storytelling. The bottleneck is everything that happens after the master design is approved.
Recent data highlights the issue:
Smartly found 68% of marketers say digital ad creation still involves time‑consuming manual processes.
74% say delivery is also manual and slow.
48% list "producing enough creative" as a top pain point.
What this looks like inside your team:
Designers spending hours on resizing, versioning, and exports, not on improving creative.
Ad ops chasing files across Figma, Adobe, email, Slack, and ad platforms.
Brands exposed to risk from off‑template edits and inconsistent typography or colors.
Creative automation tools for display advertising exist to kill this non‑creative suffering. Viewst’s position is clear: banner production is infrastructure, not design.
ROI Framework: How to Calculate the Value of Creative Automation
A useful way to model the economics is a TEI‑style formula (Total Economic Impact), adapted for display campaigns.
The ROI Formula
Use this high‑level equation:
ROI = (Labor savings + Avoided outsourcing + Rework savings + Incremental testing value + Faster‑launch value − Software cost − Implementation cost) / (Software cost + Implementation cost)
You can calculate each component with simple, measurable inputs.
Core Variables
Define these variables for your team:
N = banners or variants produced per month
Tₘ = manual minutes per banner (current workflow)
Tₐ = automated minutes per banner (new workflow)
R = fully loaded hourly labor rate for production staff
Q = rework hours avoided per month
S = outsourced production spend avoided per month
V = monetary value of extra tests / winners found per month
F = monetary value of faster campaign launches per month
Base Formulas
Start with the operational backbone:
Hours saved/month =
N × (Tₘ − Tₐ) / 60Labor value saved/month =
Hours saved × RThroughput gain (x) =
Tₘ / TₐTesting capacity gain (x) =
Hours saved / hours per test cell
These are the numbers you can measure in a pilot.
Wage Anchors (for US Teams)
Use Bureau of Labor Statistics data as neutral baselines:
Graphic designers: $61,300/year (~$29.47/hour).
Web and digital interface designers: $98,090/year (~$47.30/hour).
Advertising/marketing managers: up to $161,030/year (~$76.76/hour).
If your actual compensation is higher, ROI improves even further.
What Changes With an HTML5‑Native Production Platform
Platforms like Viewst sit between design tools (Figma, Adobe) and media platforms (DSPs, ad servers). They don’t replace your craft; they remove manual production work.
Key capabilities that drive the 80% time reduction:
AI Smart Resize – all formats from one master asset.
AI Image Deflatening – flat images become editable HTML5 designs.
AI Designer – prompts converted into structured banner sets.
AI Instant Animator – one‑click motion across layers.
True WYSIWYG editor – what you see equals what the ad server gets.
Figma / Adobe import + brandbooks – your system of record stays intact.
Production‑ready export – HTML5, GIF, MP4 with ad‑network‑ready files.
Because everything is governed from a single master creative, updates propagate without rebuilding every size manually. This is where the 5x throughput shows up in practice.
Scenario 1: Brand Creative Team (Mid‑Market SaaS or Retail)
Assumptions:
N = 120 banners/month.
Current workflow: Tₘ = 60 minutes/banner (concept, resize, animate, export).
Automated workflow: Tₐ = 12 minutes/banner with Viewst or similar.
Labor rate: R ≈ $29.47/hour (BLS graphic designer median).
One test cell = 8 banners across formats.
Time Saved
Hours saved/month =
120 × (60 − 12) / 60=120 × 48 / 60= 96 hours.Throughput gain =
60 / 12= 5x.
Direct Cost Reduction
Labor value saved/month =
96 × $29.47≈ $2,829.Labor value saved/year ≈ $33,951.
If your designers are above median pay or you include benefits, real savings are higher.
Increased Testing Capacity
Manual world:
Practical testing capacity =
96 hours / (8 banners × 60 minutes)≈ 12 test cells.
Automated world:
With the same 96 hours reallocated, tests use automated production time.
Each test cell now takes
8 × 12 minutes = 96 minutes = 1.6 hours.Testing capacity =
96 hours / 1.6≈ 60 test cells.
That’s 5x more testing—matching the throughput gain.
From Google research:
Advertisers see 2x more conversions on average when adding a responsive display ad to an ad group with a static display ad.
Google recommends 3 weeks of learning for new campaigns and 2–3 weeks after creative changes for optimal performance.
If automation lets you test 5x more creative variants without adding headcount, you’re compounding the conversion gains Google already observes.
Scenario 2: Digital Agency (Multi‑Client Display Production)
Assumptions:
N = 300 banners/month across several accounts.
Current workflow: Tₘ = 60 minutes/banner.
Automated workflow: Tₐ = 12 minutes/banner.
Labor rate: R ≈ $47.30/hour (BLS web/digital interface designer median).
One test cell = 8 banners.
Time Saved
Hours saved/month =
300 × (60 − 12) / 60=300 × 48 / 60= 240 hours.Throughput gain =
60 / 12= 5x.
Direct Cost Reduction
Labor value saved/month =
240 × $47.30≈ $11,353.Labor value saved/year ≈ $136,232.
For many agencies, this matches or exceeds annual license cost for a top creative automation software for display advertising.
Increased Testing and Capacity per Client
Manual world:
Effective testing capacity =
240 hours / (8 banners × 60 minutes)= 30 test cells.
Automated world:
Each test cell uses
8 × 12 minutes = 96 minutes = 1.6 hours.Testing capacity =
240 hours / 1.6≈ 150 test cells.
This unlocks:
Robust A/B and multivariate testing across more clients.
Higher service levels (more localized versions per market, more tailored offers).
Potential to productize creative testing packages without increasing headcount.
Agency case studies from vendors show similar dynamics:
Forrester’s Adobe TEI composite enterprise (300 campaigns/year, 550,000+ assets) modeled 461% ROI, 70–80% faster variant production, and up to 75% less review/fix time.
Scenario 3: Performance Marketing Team (Growth‑Focused Brand)
Assumptions:
N = 80 banners/month.
Current workflow: Tₘ = 60 minutes/banner.
Automated workflow: Tₐ = 12 minutes/banner.
Labor rate: R ≈ $76.76/hour (advertising/marketing manager proxy).
One test cell = 8 banners.
Time Saved
Hours saved/month =
80 × (60 − 12) / 60=80 × 48 / 60= 64 hours.
Direct Cost Reduction
Labor value saved/month =
64 × $76.76≈ $4,913.Labor value saved/year ≈ $58,952.
Because performance marketers are expensive, every hour reclaimed from production has outsized value.
Increased Testing Capacity
Manual world:
Testing capacity =
64 hours / (8 banners × 60 minutes)≈ 8 test cells.
Automated world:
Each test cell uses
8 × 12 minutes = 96 minutes = 1.6 hours.Testing capacity =
64 hours / 1.6≈ 40 test cells.
Going from 8 to 40 test cells per month allows:
Systematic testing of headline, image, CTA, and offer combinations.
Better alignment with Google’s recommendation for 2–3 weeks of optimization after asset changes.
Faster iteration cycles when a winner is detected.
Beyond Labor: Other ROI Levers You Should Model
The labor numbers alone often justify automation. But to create a robust creative automation ROI calculator, include these additional levers.
1. Avoided Outsourcing (S)
If you’re paying external studios or freelancers to handle peak workloads or micro‑resizes:
Track monthly spend on banner production.
Estimate % of work you can bring in‑house once your team has automation.
Example:
Current outsourced spend: $8,000/month.
Automation lets you bring 50% in‑house.
S = $4,000/month in avoided outsourcing.
2. Rework and Brand Risk (Q)
With manual production:
Fonts, colors, and logos drift from brand standards.
Local adaptations go off‑template.
You lose time fixing files and managing last‑minute corrections.
With locked brandbooks and an HTML5 ad production platform:
Fewer rounds of edits.
Less QA time in ad ops.
Estimate:
Rework hours avoided per month Q and multiply by your hourly rate.
3. Faster Launch Value (F)
Faster production brings campaigns to market sooner.
If automation cuts launch lead times by a week, and your typical weekly media spend is profitable:
Approximate the incremental revenue or margin from one extra week live.
Use historical ROAS or conversion data to estimate F per campaign.
This is especially material for:
Seasonal campaigns (Black Friday, back‑to‑school).
Short‑window promos (flash sales, app launches).
Putting It All Together: A Simple ROI Checklist
To evaluate the best software for creating and managing display ads, build a basic spreadsheet with input cells for:
Volume & Time
Banners per month (N).
Current minutes per banner (Tₘ).
Expected minutes per banner post‑automation (Tₐ).
Cost Inputs
Hourly rate for designers/production (R).
Outsourcing spend for banners (S).
Quality & Speed Inputs
Rework hours avoided (Q).
Value of faster launches per campaign (F).
Value per uplift in conversion rate from additional testing (V).
Software & Implementation Costs
Annual license fees for your chosen HTML5 ad production platform.
Onboarding, training, and process change costs.
Then calculate:
Hours saved/month.
Labor savings/month.
Total benefit/year.
Payback period: Implementation cost ÷ monthly benefit.
ROI over 3 years using the TEI formula.
This is the basis of a defensible business case for tools like Viewst.
Why Viewst Fits This ROI Story Specifically
Viewst is built for HTML5‑native banner production under pressure—tight deadlines, multiple formats, and zero tolerance for instability.
For creative and production leaders, Viewst:
Treats master creative as the single source of truth for all variations.
Uses AI to handle resizes, animation, and file prep, not to replace concepting.
Enforces brandbooks and governance so automation reinforces brand standards.
Brings feedback and approvals inside the production environment, instead of scattered screenshots.
For teams running hundreds or thousands of display assets across markets, this is the infrastructure layer that connects design tools to media platforms and unlocks the 80% time reduction modeled above.
FAQ: ROI of Creative Automation for Display Campaigns
1. Is an 80% reduction in banner production time realistic?
Yes. Case studies show reductions between 75–83%:
SCMP went from 1 hour to 10–15 minutes per banner.
McDonald’s Finland cut repeat launches from 27.5 hours to 2 hours.
Modeling 60 minutes to 12 minutes per banner as your benchmark is realistic for a modern creative automation platform.
2. How do I calculate cost per banner production in my agency?
Use:
Cost per banner =
(Minutes per banner ÷ 60) × hourly rate.
Example (manual):
60 minutes/banner, $47.30/hour →
(60 ÷ 60) × 47.30≈ $47.30 per banner.
Example (automated):
12 minutes/banner, same rate →
(12 ÷ 60) × 47.30≈ $9.46 per banner.
That’s an 80% cost reduction per banner.
3. How much time does creative automation actually save designers?
Directionally:
A shift from 60 to 12 minutes per banner saves 48 minutes per asset.
At 120 banners/month, that’s 96 hours saved.
At 300 banners/month, that’s 240 hours saved.
Most of that time is currently spent on non‑creative tasks like resizing, versioning, and exports.
4. How does automation impact testing and optimization?
By cutting production time per banner, you free hours that can be reinvested into testing.
As shown in the scenarios:
Brand team: 5x more test cells (12 → 60 per month).
Agency: 5x more test cells (30 → 150 per month).
Performance team: 5x more test cells (8 → 40 per month).
This aligns with Google’s guidance that campaigns need weeks of data and multiple assets to fully optimize.
5. Where does Viewst sit in my existing stack?
Viewst sits between your design tools and your media stack:
Import from Figma or Adobe → automate production → export HTML5/GIF/MP4 to ad servers and DSPs.
It’s not a general‑purpose design tool or a generic AI image generator.
It’s specialized production infrastructure for display campaigns.
For Heads of Creative, Design Directors, and Creative Operations leads handling high‑volume display work, this is the layer that unlocks the ROI modeled above—without compromising creative control.

Victoria is the CEO at Viewst. She is a serial entrepreneur and startup founder. She worked in Investment Banking for 9 years as international funds sales, trader, and portfolio manager. Then she decided to switch to her own startup. In 2017 Victoria founded Profit Button (a new kind of rich media banners), the project has grown to 8 countries on 3 continents in 2 years. In 2021 she founded Viewst startup. The company now has clients from 43 countries, including the USA, Canada, England, France, Brazil, Kenya, Indonesia, etc.
In this article
" height="11.060000000000002px" id="wzBCZ87AK" transform="translate(6.47 2.47)" width="6.590000000000003px"/></g></svg>)