
Why your creative automation wins need a case study playbook
If you’ve invested in creative automation tools for display advertising, the hard part isn’t proving they’re faster — it’s proving they reduce workload pressure, protect creative quality, and improve business results.
Adobe’s 2024 State of Creativity report (global, 2024) found 83% of decision makers saw a change in employee workload in the last 12 months, and 75% plan to invest in tools/software to handle it (Adobe, 2024). Monotype’s 2025 global report adds that 57% of creative teams spend more than a quarter of their time on non-creative tasks (Monotype, 2025).
You don’t win the next budget round by saying “we resize banners faster now.” You win it with structured case studies that show:
Designer hours freed from non-creative work
Faster time-to-launch for campaigns
Better ROAS and performance from more consistent, testable creative
This playbook gives you a systematic way to document those wins.
What this case study playbook will help you do
This guide is designed for creative operations leads, heads of creative, and performance teams running high-volume display campaigns.
You’ll get:
A before/after case study template tailored to creative automation
Clear metrics for operational and performance impact
A story format that resonates with executives
A worked example case study using realistic numbers
A short methods appendix so you can measure consistently
We’ll use Viewst — an HTML5 ad production platform — as the reference infrastructure for banner ad production automation, but the framework applies to any modern creative automation software for display advertising.
Step 1: Align case studies with the problem automation actually solves
Creative automation platforms for display advertising don’t exist just to crank out more assets. They exist to remove non-creative suffering from creative work — especially around banner ad production.
Common problems worth documenting:
Production bottlenecks: dozens of sizes and variants with no scalable way to execute
Manual resizing and versioning: senior designers spending hours on formats instead of concepts
Brand risk: off-template edits, inconsistent fonts/colors, unmanaged market adaptations
Slow approvals: feedback scattered across email, chat, and decks
Global benchmark data shows you’re not alone: a 2025 offshore creative production report (global, 2025) found digital banners are the #1 asset companies expect to automate (32%), and 44% of content producers already automate up to 20% of total production output (WeAreAmnet, 2025).
Your case studies should connect these pain points directly to measured outcomes.
Step 2: Core metrics — before and after creative automation
The most persuasive creative automation ROI case studies combine operational proof with performance proof.
Operational metrics (creative operations)
Track these before and after adopting tools like Viewst:
Time-to-launch (TTL)
Definition: hours from receiving a brief to first ad set going live
Designer hours spent on non-creative tasks
Definition: total hours per month on resizing, versioning, exporting, and file prep
Number of variations per campaign
Definition: count of distinct creative variations (size × message × audience)
Production cycle time per banner set
Definition: hours from master creative ready to all required sizes exported
Revision rounds per campaign
Definition: number of formal review cycles before sign-off
Industry examples show what “good” looks like:
Samsung produced 400+ variations in under five days and more than doubled ROAS in a global campaign using data-driven creatives (global, ~2016–2018) (Google Marketing Platform).
McDonald’s cut repeat launch time from 27.5 hours to 2 hours for some campaigns (market: EMEA, reported around 2019–2020) in similar automation case studies (Google Marketing Platform).
South China Morning Post (SCMP) reported 2.8x efficiency and 200% more monthly production after adopting creative automation for display ads (APAC, ~2020+), from vendor case materials summarised in market analyses.
These aren’t your numbers — yet. Your case study should mirror this before/after structure using your own data.
Performance metrics (media & growth)
To avoid “efficiency only” case studies, connect creative automation to:
ROAS (Return on Ad Spend)
Definition: revenue generated ÷ ad spend, over a defined attribution window
CTR (Click-through Rate)
Definition: clicks ÷ impressions
Conversion rate (CVR)
Definition: conversions ÷ clicks
Cost per acquisition (CPA)
Definition: ad spend ÷ conversions
Top creative variations share of spend
Definition: % of spend consumed by top-performing creatives
AppsFlyer’s 2024 global report (mobile apps, 2024) found the top 2% of creative variations consume 68% of ad spend (AppsFlyer, 2024). That’s why your case studies should show variation-level performance, not just campaign averages.
Step 3: Case study template for creative automation (operational + performance)
Use this structured template every time you document a win.
1. Setting
Team: who was involved (e.g., in-house creative team + performance marketing)
Campaign: product/service, markets, channels (e.g., US, programmatic display + retail media)
Initial challenge: 2–3 sentences, grounded in data
Example: “Our team was shipping 20–30 banner sets per month. Designers spent 35–40% of their time on manual resizing and exports. Repeat launches took 2–3 days.”
2. Conflict (before automation)
Bullet key pain points with metrics:
Time-to-launch from brief to go-live: 36–48 hours
Designer hours on non-creative tasks per month: 220 hours
Variations per campaign: 12–15 with limited localization
Review cycles: 4–5 rounds across email, slides, and chat
Include a quote from your creative lead or production manager.
“Our senior designers were acting like production coordinators. Formats, exports, and last-minute resizes ate entire days.”
3. Intervention (what changed)
Explain the creative automation tools and workflow changes:
Platform introduced (e.g., Viewst HTML5 ad production platform)
Scope: which campaigns or accounts moved into the new workflow
Features used:
AI Smart Resize: master creative to all required sizes
AI Instant Animator: one-click motion across layers
Brandbooks and locked styles: typography and colors enforced
Figma/Adobe import: source-of-truth design files ingested
Integrated review and approval: comments and sign-off inside the banner set
Tie each feature to a measurable outcome (e.g., fewer manual resizes, fewer off-brand edits).
4. Results — before and after metrics for creative automation
Create a simple table for operational and performance metrics.
Operational metrics
Time-to-launch: before 40 hours → after 10 hours (–75%)
Average designer hours per banner set: before 6 hours → after 1.5 hours (–75%)
Variations per campaign: before 15 → after 60 (+300%)
Revision rounds: before 4–5 → after 2 (–50%)
Performance metrics
ROAS (7-day attribution): before 3.2x → after 3.9x (+21%)
CTR: before 0.45% → after 0.62% (+38%)
CPA: before $48 → after $39 (–19%)
Call out whether results are from A/B tests, phased rollouts, or aggregate quarterly data.
5. Qualitative feedback
Document human impact:
Designer sentiment: short quotes on reduced burnout and more time for concepting
Stakeholder feedback: marketers, brand managers, regional leads
Observed changes in process: fewer last-minute escalations, better brand consistency
For example, Monotype’s 2025 research (global, 2025) shows 43% of teams now track creative ROI per project (Monotype, 2025). Your qualitative section should show leaders feel the ROI in their workflow.
6. Story format for executives
Executives remember narratives better than raw numbers. Harvard Business School’s data storytelling framework (global, 2020s) recommends combining data, narrative, and visualizations (HBS Online, 2023).
Use the simple Setting → Conflict → Resolution → Outcome → Next steps arc:
Setting: “Q2 U.S. acquisition campaigns for our app-first business.”
Conflict: “Workload overwhelmed our 10-person design team; TTL averaged 2 days.”
Resolution: “We introduced Viewst as our HTML5 ad production platform and standardized workflows around master creatives.”
Outcome: “TTL dropped 75%, ROAS improved 21%, and designers reclaimed ~40% of their week for concepting.”
Next steps: “We’ll extend this workflow to EMEA and retail media placements, with a shared performance dashboard.”
Ragan’s guidance on presenting data-backed insights (US, 2023) says to lead with the business outcome, not the tool, and avoid overloading audiences with every statistic (Ragan, 2023).
Worked example: internal creative automation ROI case study
Below is a fully worked example your team can copy, anonymize, and adapt.
Setting
Team: U.S. in-house creative studio (18 people) + performance marketing pod
Brand: mid-market SaaS, app-first business
Channel: programmatic display and retail media; HTML5 and GIF banners
Period: Q1 vs. Q2 2026
Conflict (before Viewst)
Avg. time-to-launch for a new banner set: 48 hours from brief to live
Designer hours on non-creative tasks: 260 hours/month (resizing, exporting)
Variations per campaign: 18 (6 sizes × 3 messages)
ROAS (7-day, last-click attribution): 3.0x
Qualitative notes:
“Two senior designers were effectively our resize team. Campaign teams waited days for banner sets, and we avoided tests because production was too heavy.” — Creative Director
Intervention (Viewst deployment)
Implemented Viewst as the HTML5 ad production platform between Figma and ad server
Introduced AI Smart Resize for master creative → 15 sizes per campaign
Used AI Instant Animator for motion built from still Figma exports
Established brandbooks with locked typography and colors
Moved review and approvals into Viewst banner sets; stopped using decks for annotations
Scope:
6 major Q2 campaigns
U.S. only, with 3 language variants (English, Spanish, simplified localization)
Results — before/after metrics
Operational
Time-to-launch (TTL): before 48 hours, after 12 hours (–75%)
Designer hours on non-creative tasks: before 260, after 90 per month (–65%)
Variations per campaign: before 18, after 72 (+300%)
Revision rounds: before 4–5, after 2 (–50%)
Performance (7-day ROAS, programmatic display only)
ROAS: before 3.0x, after 3.6x (+20%)
CTR: before 0.40%, after 0.55% (+37.5%)
CPA: before $50, after $41 (–18%)
Measurement notes:
Q1 vs. Q2 comparison using the same product line, similar budgets
Campaigns split 50/50 between legacy workflow and Viewst-based workflow for 4 weeks, then all moved to Viewst for the remainder of Q2
Qualitative feedback:
“The biggest shift wasn’t just speed. We could finally run meaningful A/B tests with 70+ variations without burning out the team.” — Head of Growth
“We stopped arguing about fonts in screenshots. Brandbooks in Viewst kept everything consistent, and reviews happened directly in the banners.” — Design Director
Executive story summary:
Business outcome: 20% ROAS uplift and 18% lower CPA in display campaigns
Operational outcome: 170 designer hours/month reclaimed and TTL cut by 75%
Strategic impact: capacity to scale test volume and support new markets without increasing headcount
Creative automation tools for display advertising: platform comparison and selection criteria
When you document wins, executives will ask how your chosen platform compares to other creative automation software for display advertising.
Here’s a concise comparison of common options (as of 2024–2026, based on public positioning and typical deployments):
Viewst
Focus: HTML5 ad production platform; banner ad production automation
Key features: AI Smart Resize, AI Image Deflatening (flat assets → editable designs), AI Instant Animator, AI Designer (prompt → HTML5 banners), brandbooks, integrated review, native HTML5/GIF/MP4 export
Output: production-ready HTML5, GIF, MP4 with editable layers
Best for: agencies and enterprise brands with high-volume, multi-market display campaigns; teams that need native HTML5 and strict brand governance
Google Web Designer + Studio workflows
Focus: HTML5 ad creation tied to Google’s ad stack
Key features: hand-built HTML5 creatives, basic automation via DCO setups
Output: HTML5 creatives, animated assets
Best for: teams deep in Google Marketing Platform needing tight integration and willing to maintain code-heavy templates
Celtra / similar creative automation platforms
Focus: cross-channel creative automation and DCO
Key features: templated creative builds, feeds, personalization, workflows
Output: HTML5, video, rich media
Best for: large enterprises focused on personalization and omnichannel campaigns
Canva / general-purpose design tools
Focus: broad design use cases, social and lightweight display
Key features: templates, basic animation, simple collaboration
Output: images, some video, limited HTML5 via workarounds
Best for: small teams, non-specialist designers, simple display needs
When building your creative automation platform comparison for executives, emphasize:
Output type (native HTML5 vs. flat images/video)
Brand control (locked styles, brandbooks, governance)
Workflow fit (Figma/Adobe import, master creative model, review tools)
Scale (how easily the platform handles 50–500 variations)
How to document creative automation wins (step-by-step)
Use this checklist every time you capture a case.
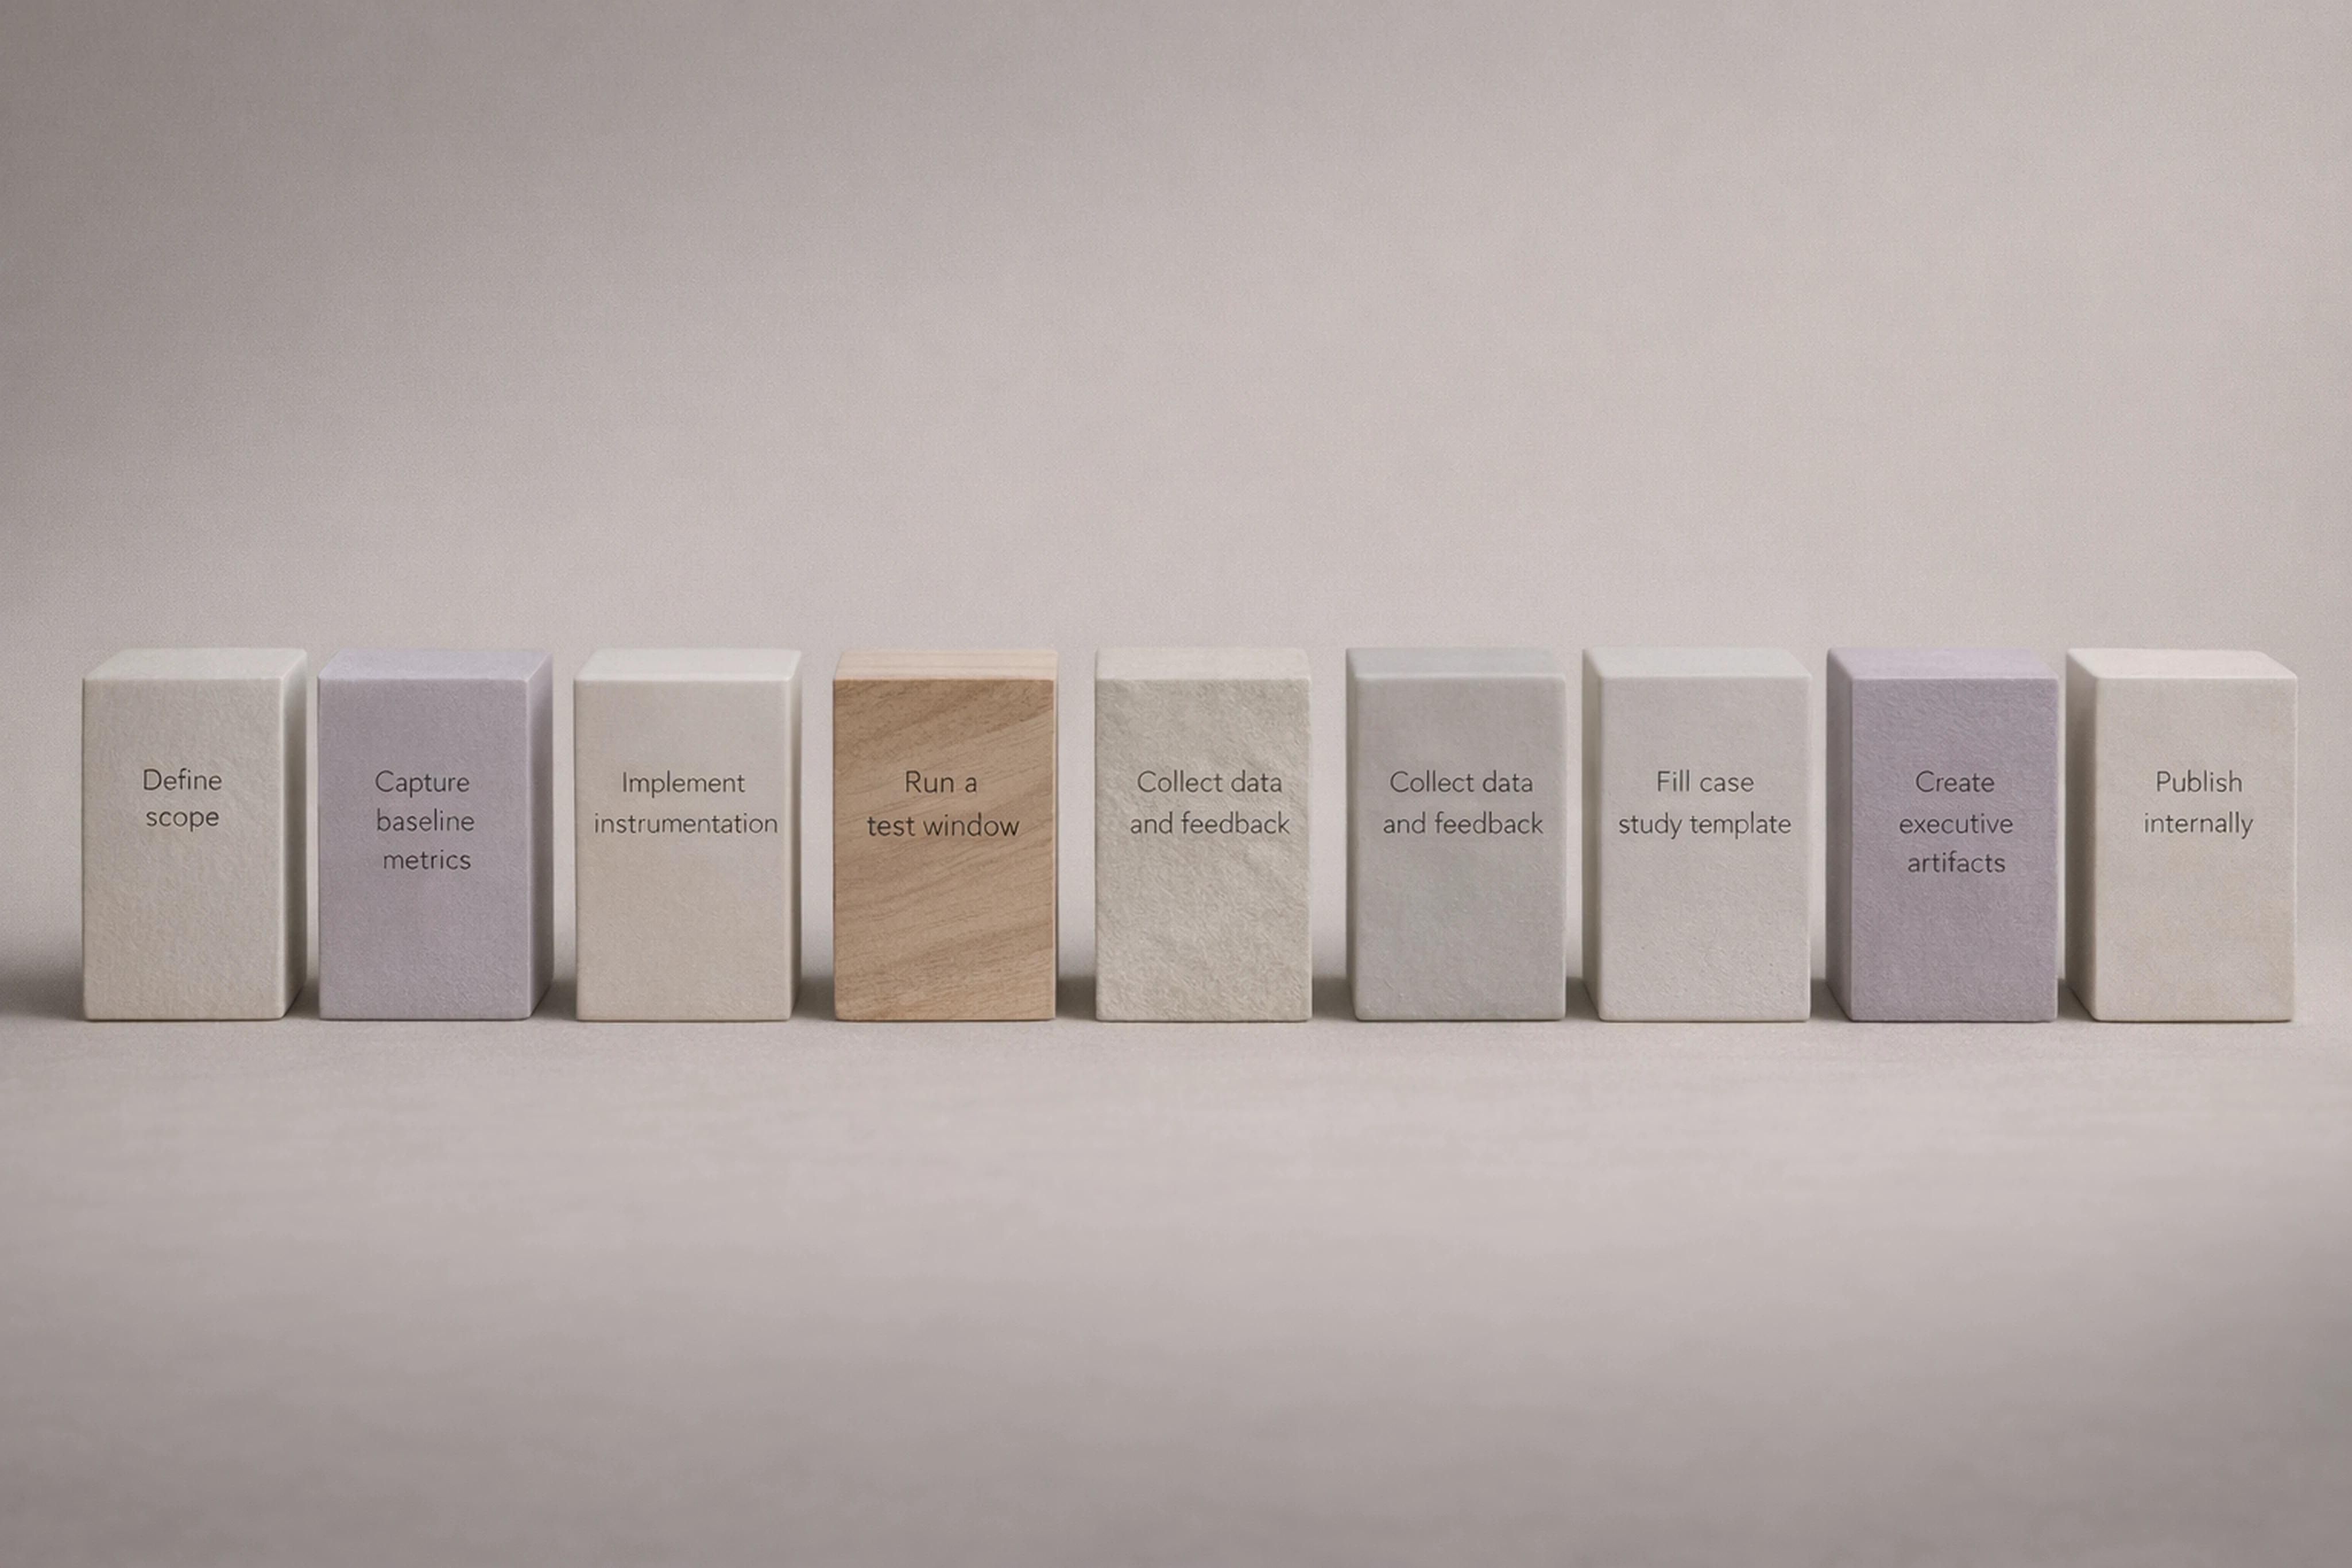
Define scope
Campaign(s), markets, formats, and period (e.g., Q3 2026, U.S. display + retail media)
Capture baseline metrics (before)
TTL, designer hours, variations, ROAS, CTR, CPA
Implement an instrumentation plan
Ensure project management tools, ad servers, and analytics are all tagged to distinguish “automation” vs. “legacy” workflows
Run a test window
4–8 weeks of side-by-side campaigns or staggered launches
Collect data and qualitative feedback
Numbers: export from PM, ad platforms, analytics
Quotes: short interviews with designers, marketers, and approvers
Fill the case study template
Setting → Conflict → Intervention → Results → Qualitative → Next steps
Create executive-friendly artifacts
One-slide summary, 2–3 key charts, 3–4 bullets for ROI highlights
Publish internally
Share in Confluence/Notion, present in QBRs, add to finance decks
Case study template for creative automation (copy & reuse)
Use this mini-template as a starting point:
Title: [Team/Brand] cut [metric] by [X%] and improved [metric] by [Y%] with creative automation
1. Setting
Team:
Markets & channels:
Period:
Tools involved (design, production, media):
2. Conflict (before)
Key pain point #1 + metric
Key pain point #2 + metric
Short quote from creative leader
3. Intervention (automation change)
Platform(s) introduced:
Workflow changes (master creative, Smart Resize, brandbooks, review process):
Scope (campaigns, markets):
4. Results (before/after metrics)
Operational: TTL, designer hours, variations, revisions
Performance: ROAS, CTR, CPA, CVR
Note on test design and attribution
5. Qualitative impact
Designer sentiment, stakeholder feedback
Observed changes in collaboration, brand consistency
6. Next steps
Where the new workflow will roll out next
New metrics to track (e.g., creative ROI per project)
How to present automation results to executives
Leaders care about business outcomes, risk, and strategic fit.
Keep automation presentations focused on three questions:
What business problem did we solve?
Example: “We reduced time-to-market for U.S. campaigns by 75% and avoided adding headcount.”
How did creative automation contribute?
Link features (Smart Resize, HTML5 ad production platform, brandbooks) directly to metrics.
What’s the strategic implication?
Example: “This gives us capacity to support three new markets and double A/B test volume without additional designers.”
Use:
1–2 charts for before/after metrics
A simple narrative arc (Setting → Conflict → Resolution → Outcome)
A short appendix with measurement details for operations-minded leaders
Methods / Measurement appendix
Consistent measurement makes your case studies trustworthy.
Metric definitions
Designer hours saved
Formula: (baseline non-creative hours per period) – (post-automation non-creative hours per period)
Baseline: time logs or estimated allocation from PM tools
Time-to-launch (TTL)
Formula: timestamp of brief intake → timestamp of first live ad
Use project management and ad server logs
ROAS (Return on Ad Spend)
Formula: revenue attributed to campaign ÷ ad spend over a stated window
Example: 7-day, last-click or data-driven attribution; specify model in each case study
CTR (Click-through Rate)
Formula: clicks ÷ impressions
Conversion rate (CVR)
Formula: conversions ÷ clicks
CPA (Cost per Acquisition)
Formula: ad spend ÷ conversions
Recommended data sources
Project management tools (Asana, Monday, Jira, Workfront)
TTL, designer hours, revision counts
Creative production platforms (Viewst, others)
Banner set counts, variation counts, export logs, review rounds
Ad servers & DSPs (Google Marketing Platform, The Trade Desk, etc.)
Impressions, clicks, conversions, spend
Analytics tools (GA4, product analytics, CRM)
Revenue attribution, post-click behavior
Statistical significance basics
Use A/B testing where possible: legacy workflow vs. automation workflow
Run tests long enough to gather adequate impressions (often 2–4 weeks)
Use simple significance calculators or your BI team to validate whether changes in CTR/ROAS are statistically significant, especially before claiming performance lifts
FAQ: Creative automation ROI, metrics, and tools
What metrics should I track for creative automation ROI?
Track both operational and performance metrics.
Operational:
Time-to-launch
Designer hours on non-creative tasks
Variations per campaign
Revision rounds
Performance:
ROAS, CTR, CVR, CPA
Top creative variations’ share of spend
These metrics align with Adobe’s recommendation to use KPIs for bottleneck identification and workflow optimization (global, 2020s) (Adobe Business, 2023).
How do I present automation results to executives?
Use a story-first, data-backed approach:
Start with the business problem and outcome (e.g., “75% faster launches, 20% ROAS uplift”)
Show 2–3 key charts for before/after metrics
Explain how creative automation tools for display advertising (like Viewst) produced those results
End with strategic next steps (markets, channels, investment needs)
Which is the best ad design software for creative agencies?
There’s no single “best,” but for high-volume display ad production:
Use Figma/Adobe for master creative and design craft
Use a specialized HTML5 ad production platform like Viewst for banner ad production automation, Smart Resize, animation, and brand governance
Integrate with your ad servers and analytics for performance measurement
General-purpose tools like Canva are fine for smaller teams, but agencies managing multi-market campaigns benefit from native HTML5 output, brandbooks, and integrated review.
How should I attribute performance gains to creative vs. media changes?
To keep your creative automation ROI case study credible:
Hold media variables (budget, bids, audiences) as constant as possible during tests
Document any media changes separately
Use A/B tests where creative workflow is the only variable
When both media and creative change, present attribution honestly: “We changed bidding strategy and increased creative test volume; together, these produced a 20% ROAS uplift.”
Forrester emphasizes that modern creative adtech must connect creative decisions to media outcomes (US, 2023) (Forrester, 2023).
How do we handle privacy and consent when using personalization in creative automation?
Follow existing data privacy and consent policies:
Ensure all audience data used in personalized display creatives complies with regulations (GDPR, CCPA) and internal policies
Avoid exposing sensitive attributes in creative
Work with legal and data privacy teams when connecting feeds or CRM data to creative automation platforms
Be transparent about AI use, in line with ANA ethics guidance (US, 2024) (ANA, 2024)
What uplift range should we expect from creative automation?
Results vary by team and baseline, but case studies from leading brands show:
2–3x production efficiency and 200%+ increase in monthly output (SCMP, APAC, ~2020)
20–100% ROAS improvements in campaigns that pair automation with better personalization (Samsung, global, 2010s) (Google Marketing Platform)
For your organization, start by targeting:
50–75% reduction in time-to-launch
20–40% reduction in designer hours on non-creative tasks
10–25% improvement in ROAS and CTR, validated with tests
How do we measure designer time accurately?
Combine:
Timesheets or time-tracking tools for detailed logging
Project management estimates for task-level effort (resizing, exporting, versioning)
Sampling: time-box a few representative projects and extrapolate
Monotype’s 2025 global report shows most teams can quantify non-creative time; 57% report spending more than a quarter of their time on such tasks (Monotype, 2025). Use your first case study to formalize this measurement.
By treating banner production as infrastructure — not design — and by documenting your wins with disciplined, data-backed case studies, you give your creative team the leverage they need to protect craft, fight burnout, and secure the tooling budget that matches the reality of modern display advertising.

Victoria is the CEO at Viewst. She is a serial entrepreneur and startup founder. She worked in Investment Banking for 9 years as international funds sales, trader, and portfolio manager. Then she decided to switch to her own startup. In 2017 Victoria founded Profit Button (a new kind of rich media banners), the project has grown to 8 countries on 3 continents in 2 years. In 2021 she founded Viewst startup. The company now has clients from 43 countries, including the USA, Canada, England, France, Brazil, Kenya, Indonesia, etc.
In this article
" height="11.060000000000002px" id="wzBCZ87AK" transform="translate(6.47 2.47)" width="6.590000000000003px"/></g></svg>)